Power BI Reporting on Freshservice
Pierian in partnership with Freshworks through the FreshInsights platform offers rich visualization and analytics solutions for Freshdesk and Freshservice in a seamless manner. FreshInsights is offered as "FreshInsights on PowerBI for Freshservice" in the Freshservice marketplace and is available to all Freshservice customers who can consume the basic Reports and Dashboards leveraging their existing Microsoft Power BI product suite without any further investments. This seamless integration between your Freshservice data and PowerBI reporting happens behind the scenes using our connectors to your Freshservice instance and using our data models and PowerBI reporting templates built by our teams.FreshInsights enables our clients to get insightful and intuitive visualizations on the performance of their customer service agents, ticket analysis and trends, response time and ticket ageing among others. While some of the features are available for free, further customisation of the data management, reporting and analytics needs are provided for a nominal fee. All your data is securely hosted on the Azure cloud with multiple security layers. Currently many hundreds of customers of Freshservice have registered with our FreshInsights solution.
Following functional areas are covered under the first phase of the application release.
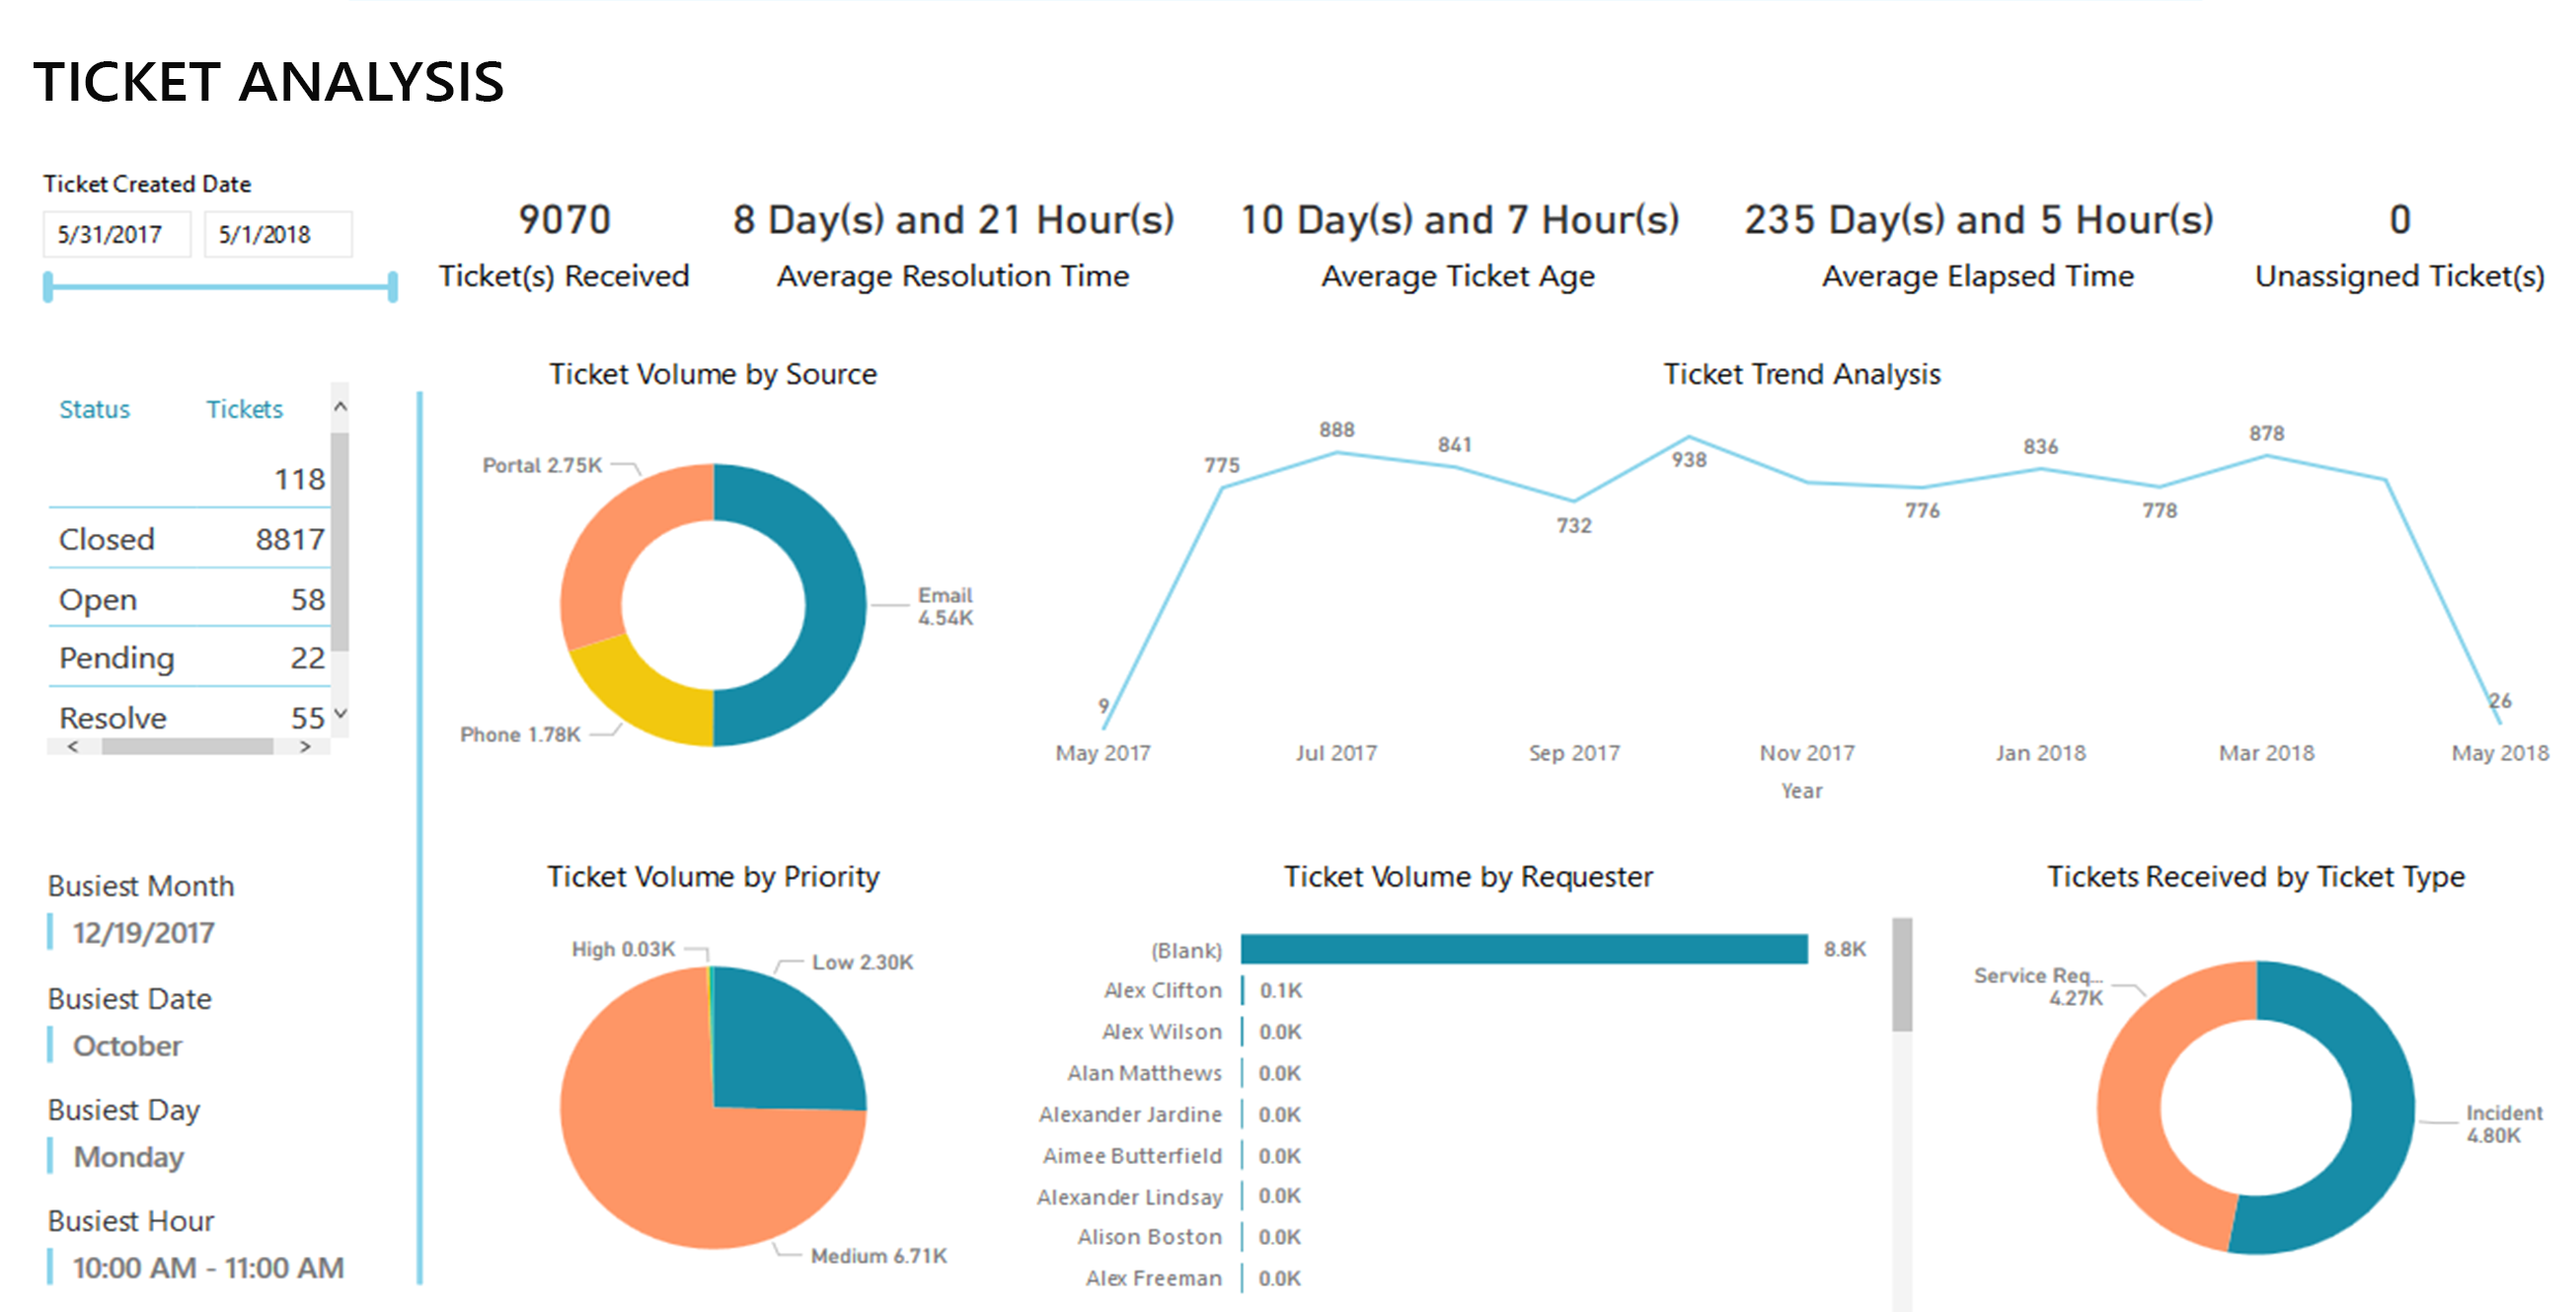
 Ticket Traffic Analysis
This dashboard provides an overview of the origin of tickets, priority, resolution time, requester along with trend analysis based on historical data.
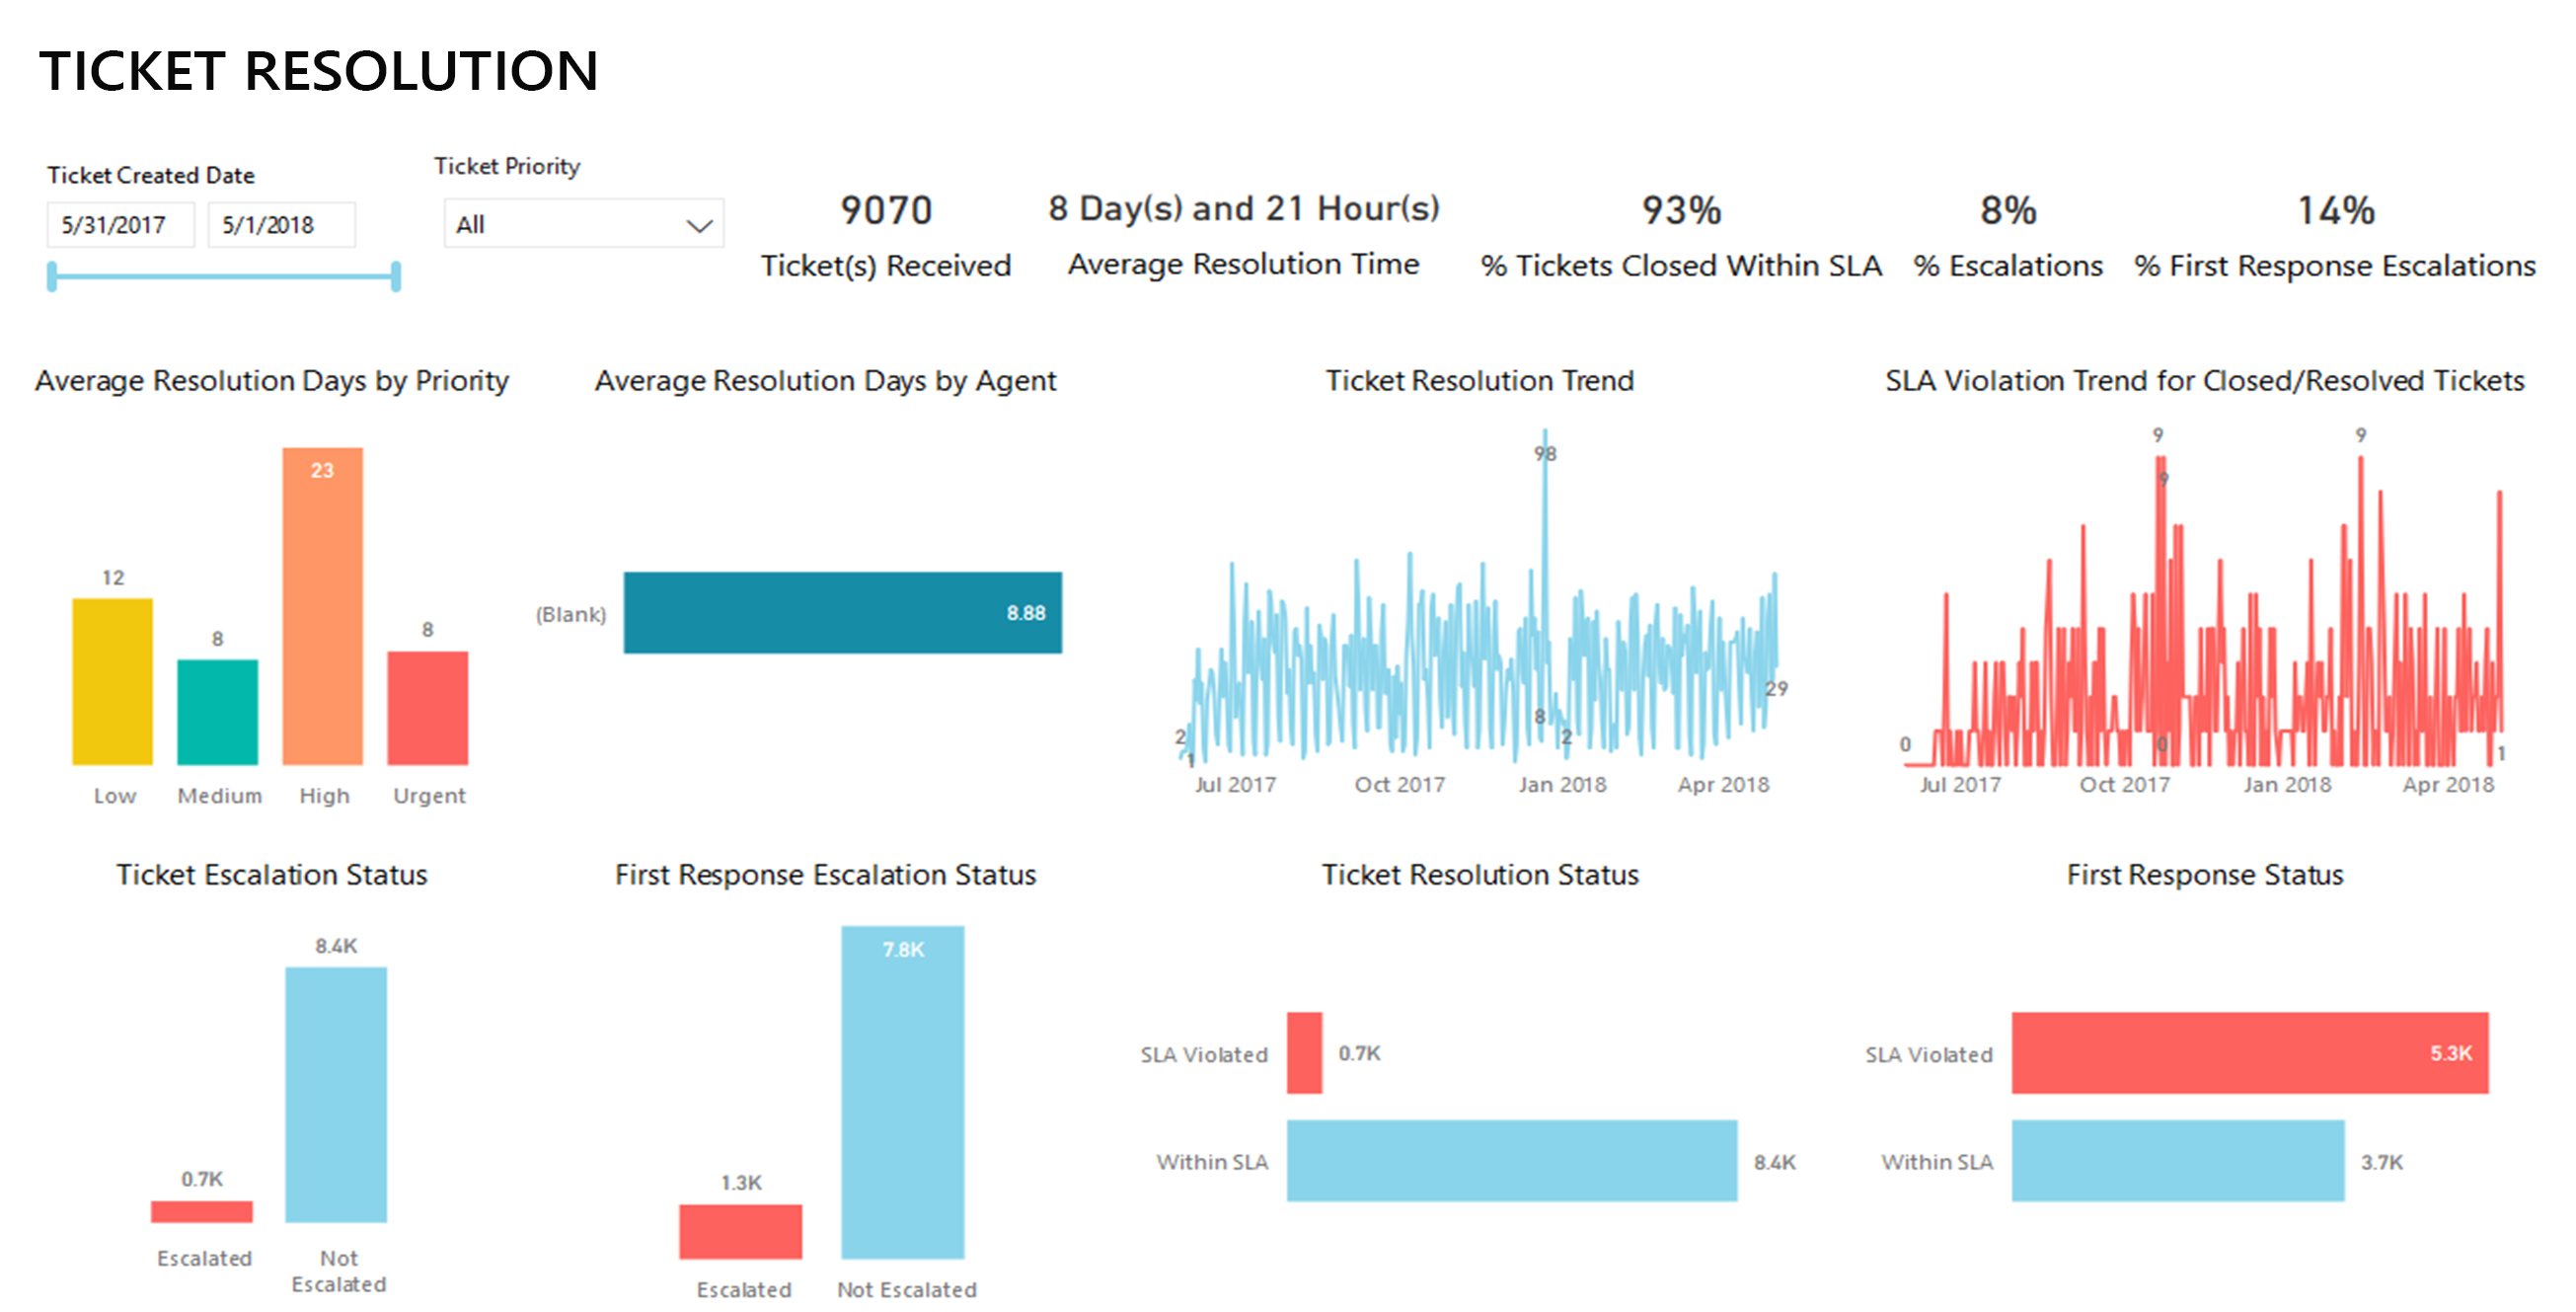
This dashboard provides analysis of tickets by priority, resolution time, first response status among others.
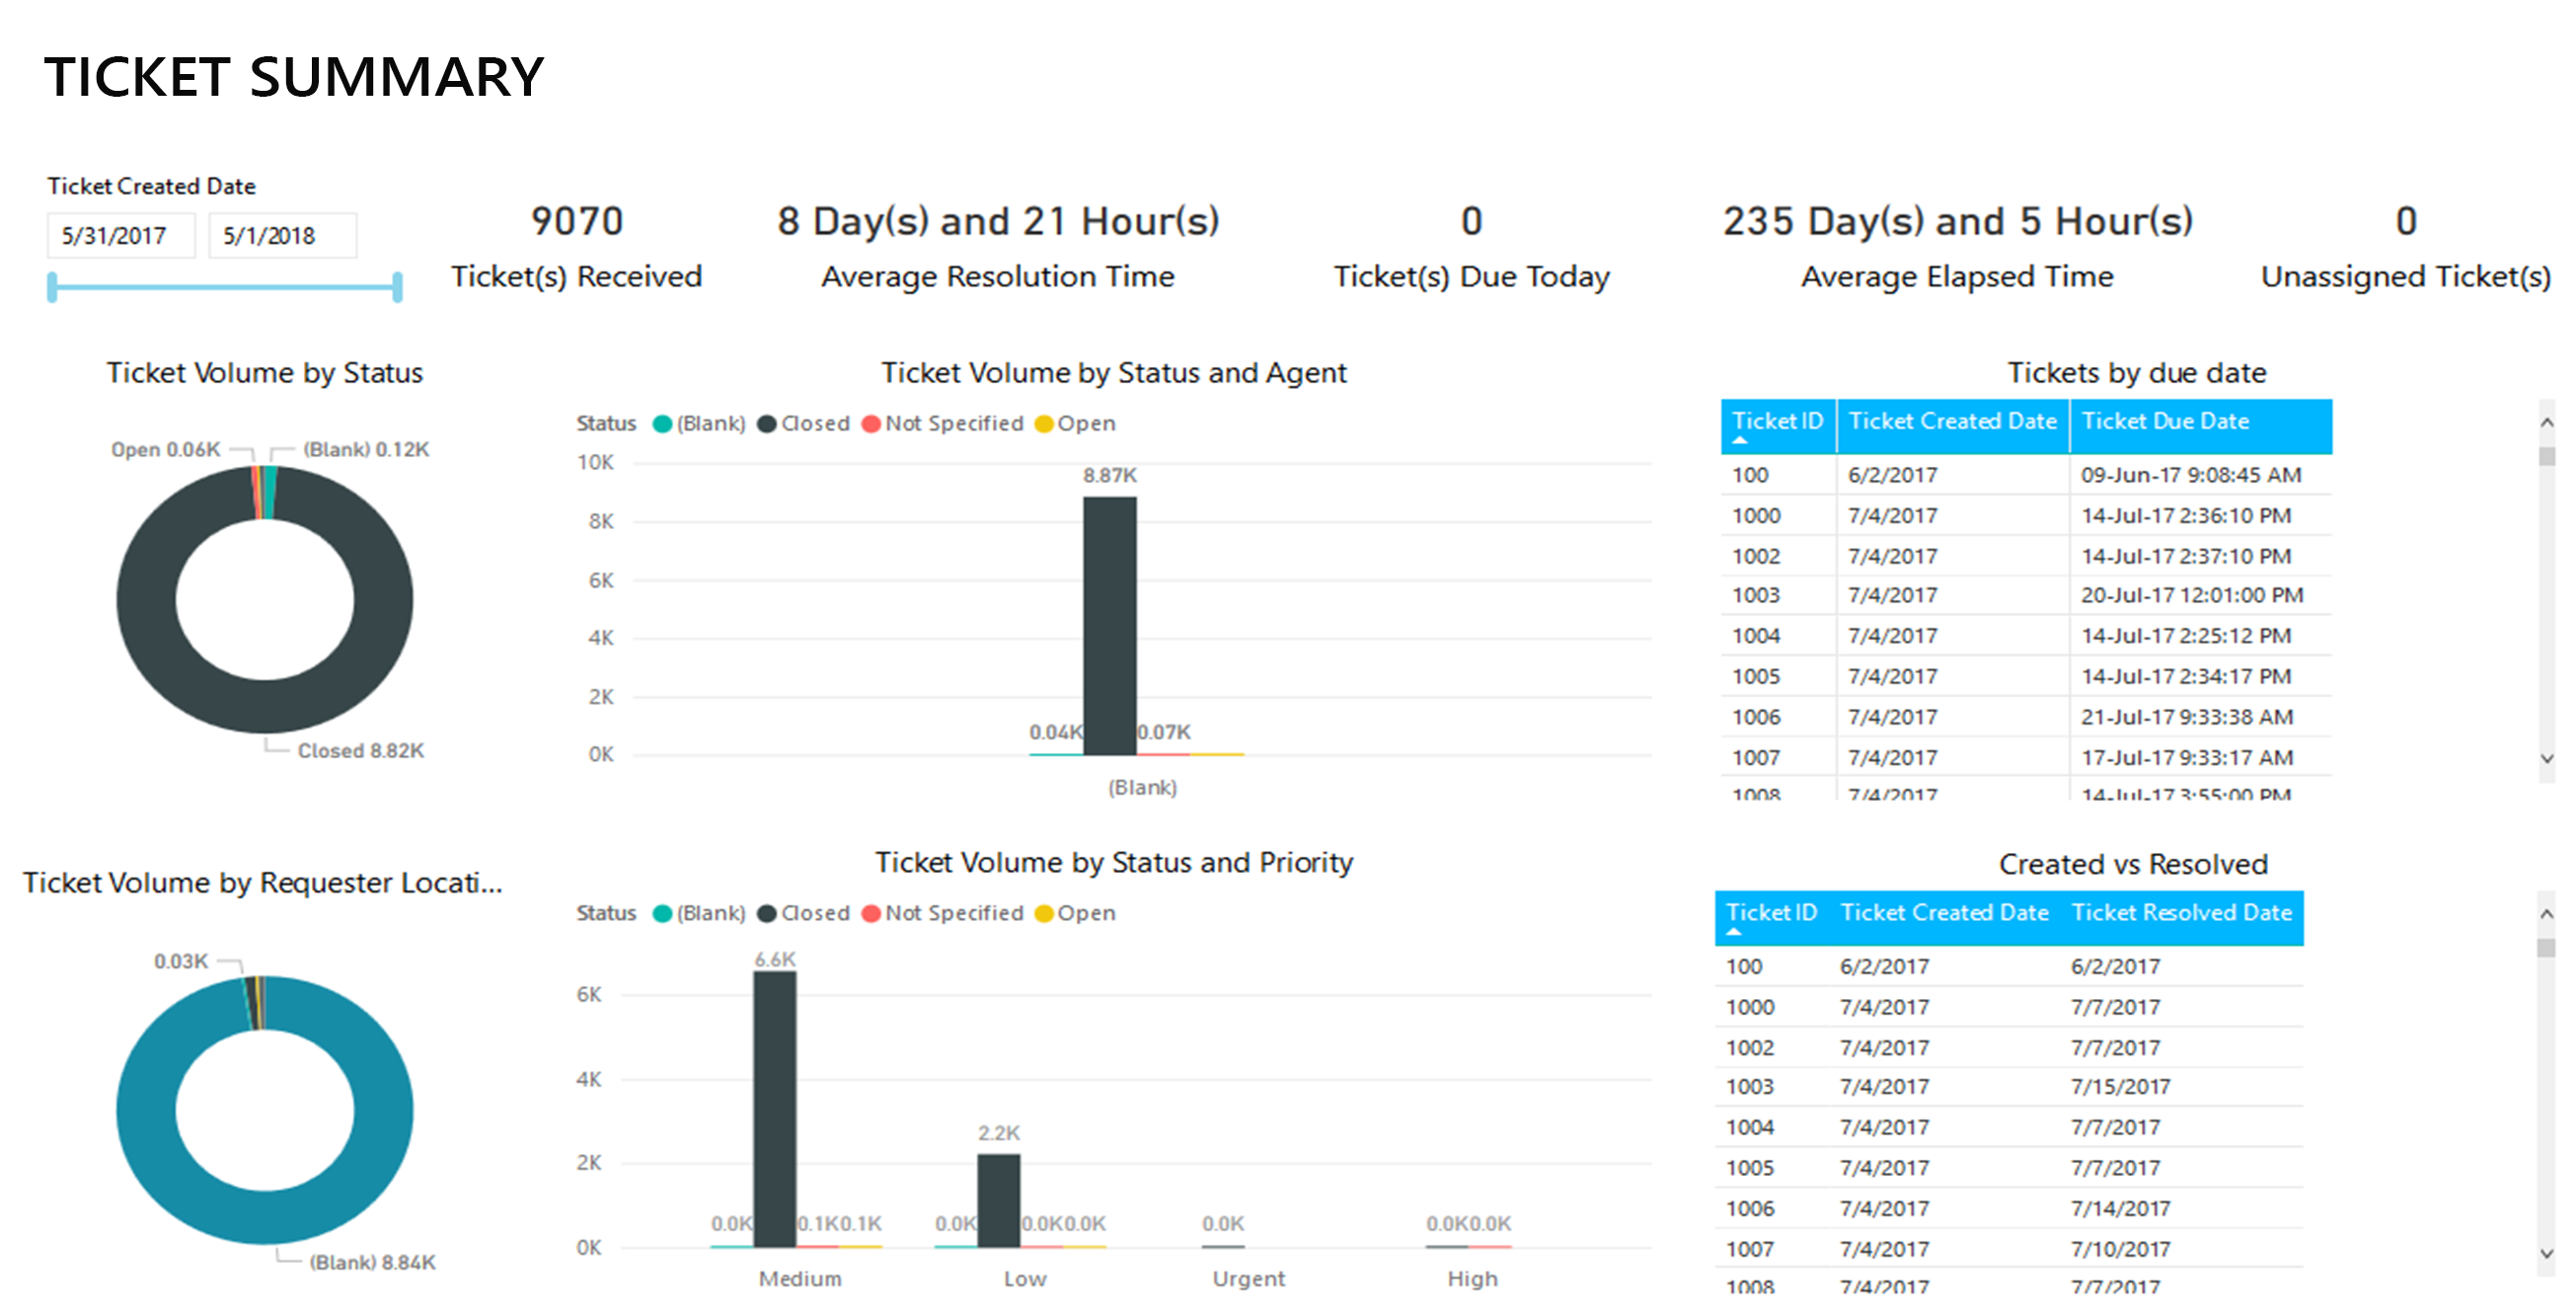
This dashboard provides an overview of the status of tickets, impact, status by agent and priority, requester location and department along with analysis based on created date vs due date and created date vs resolved date.
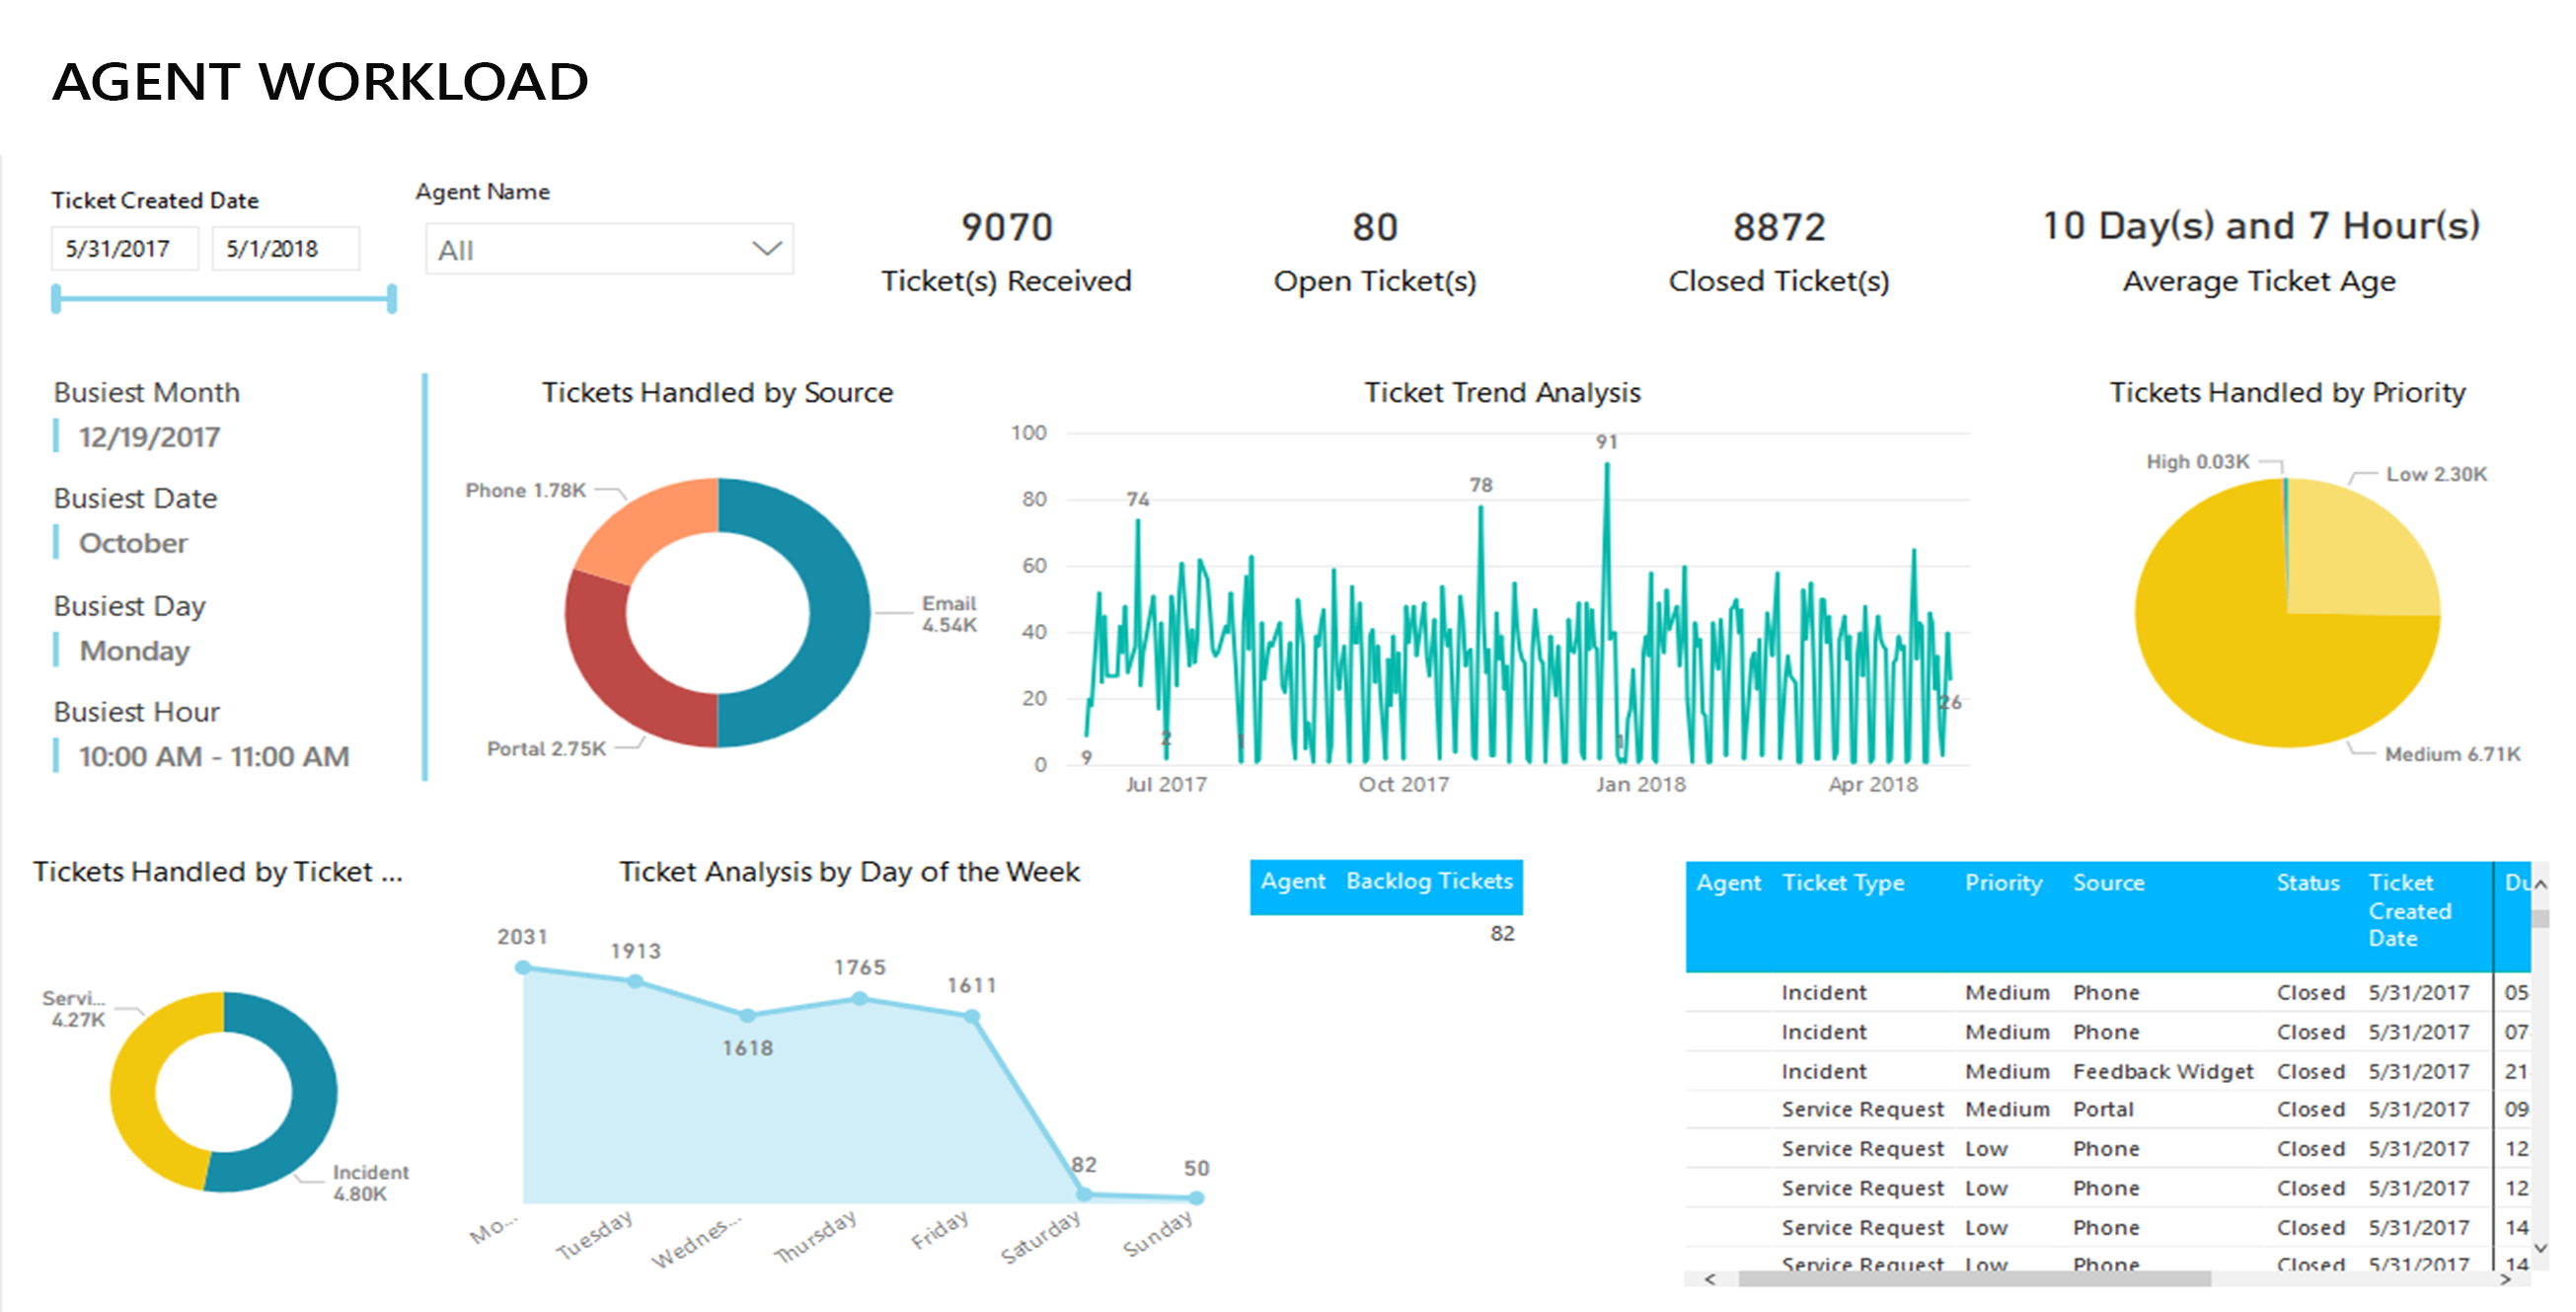
 Agent Workload Analysis
This dashboard provides complete analysis of the workload of an agent over a period of time. The Dashboard gives a view of source of the tickets, peak periods, priority levels among other parameters.
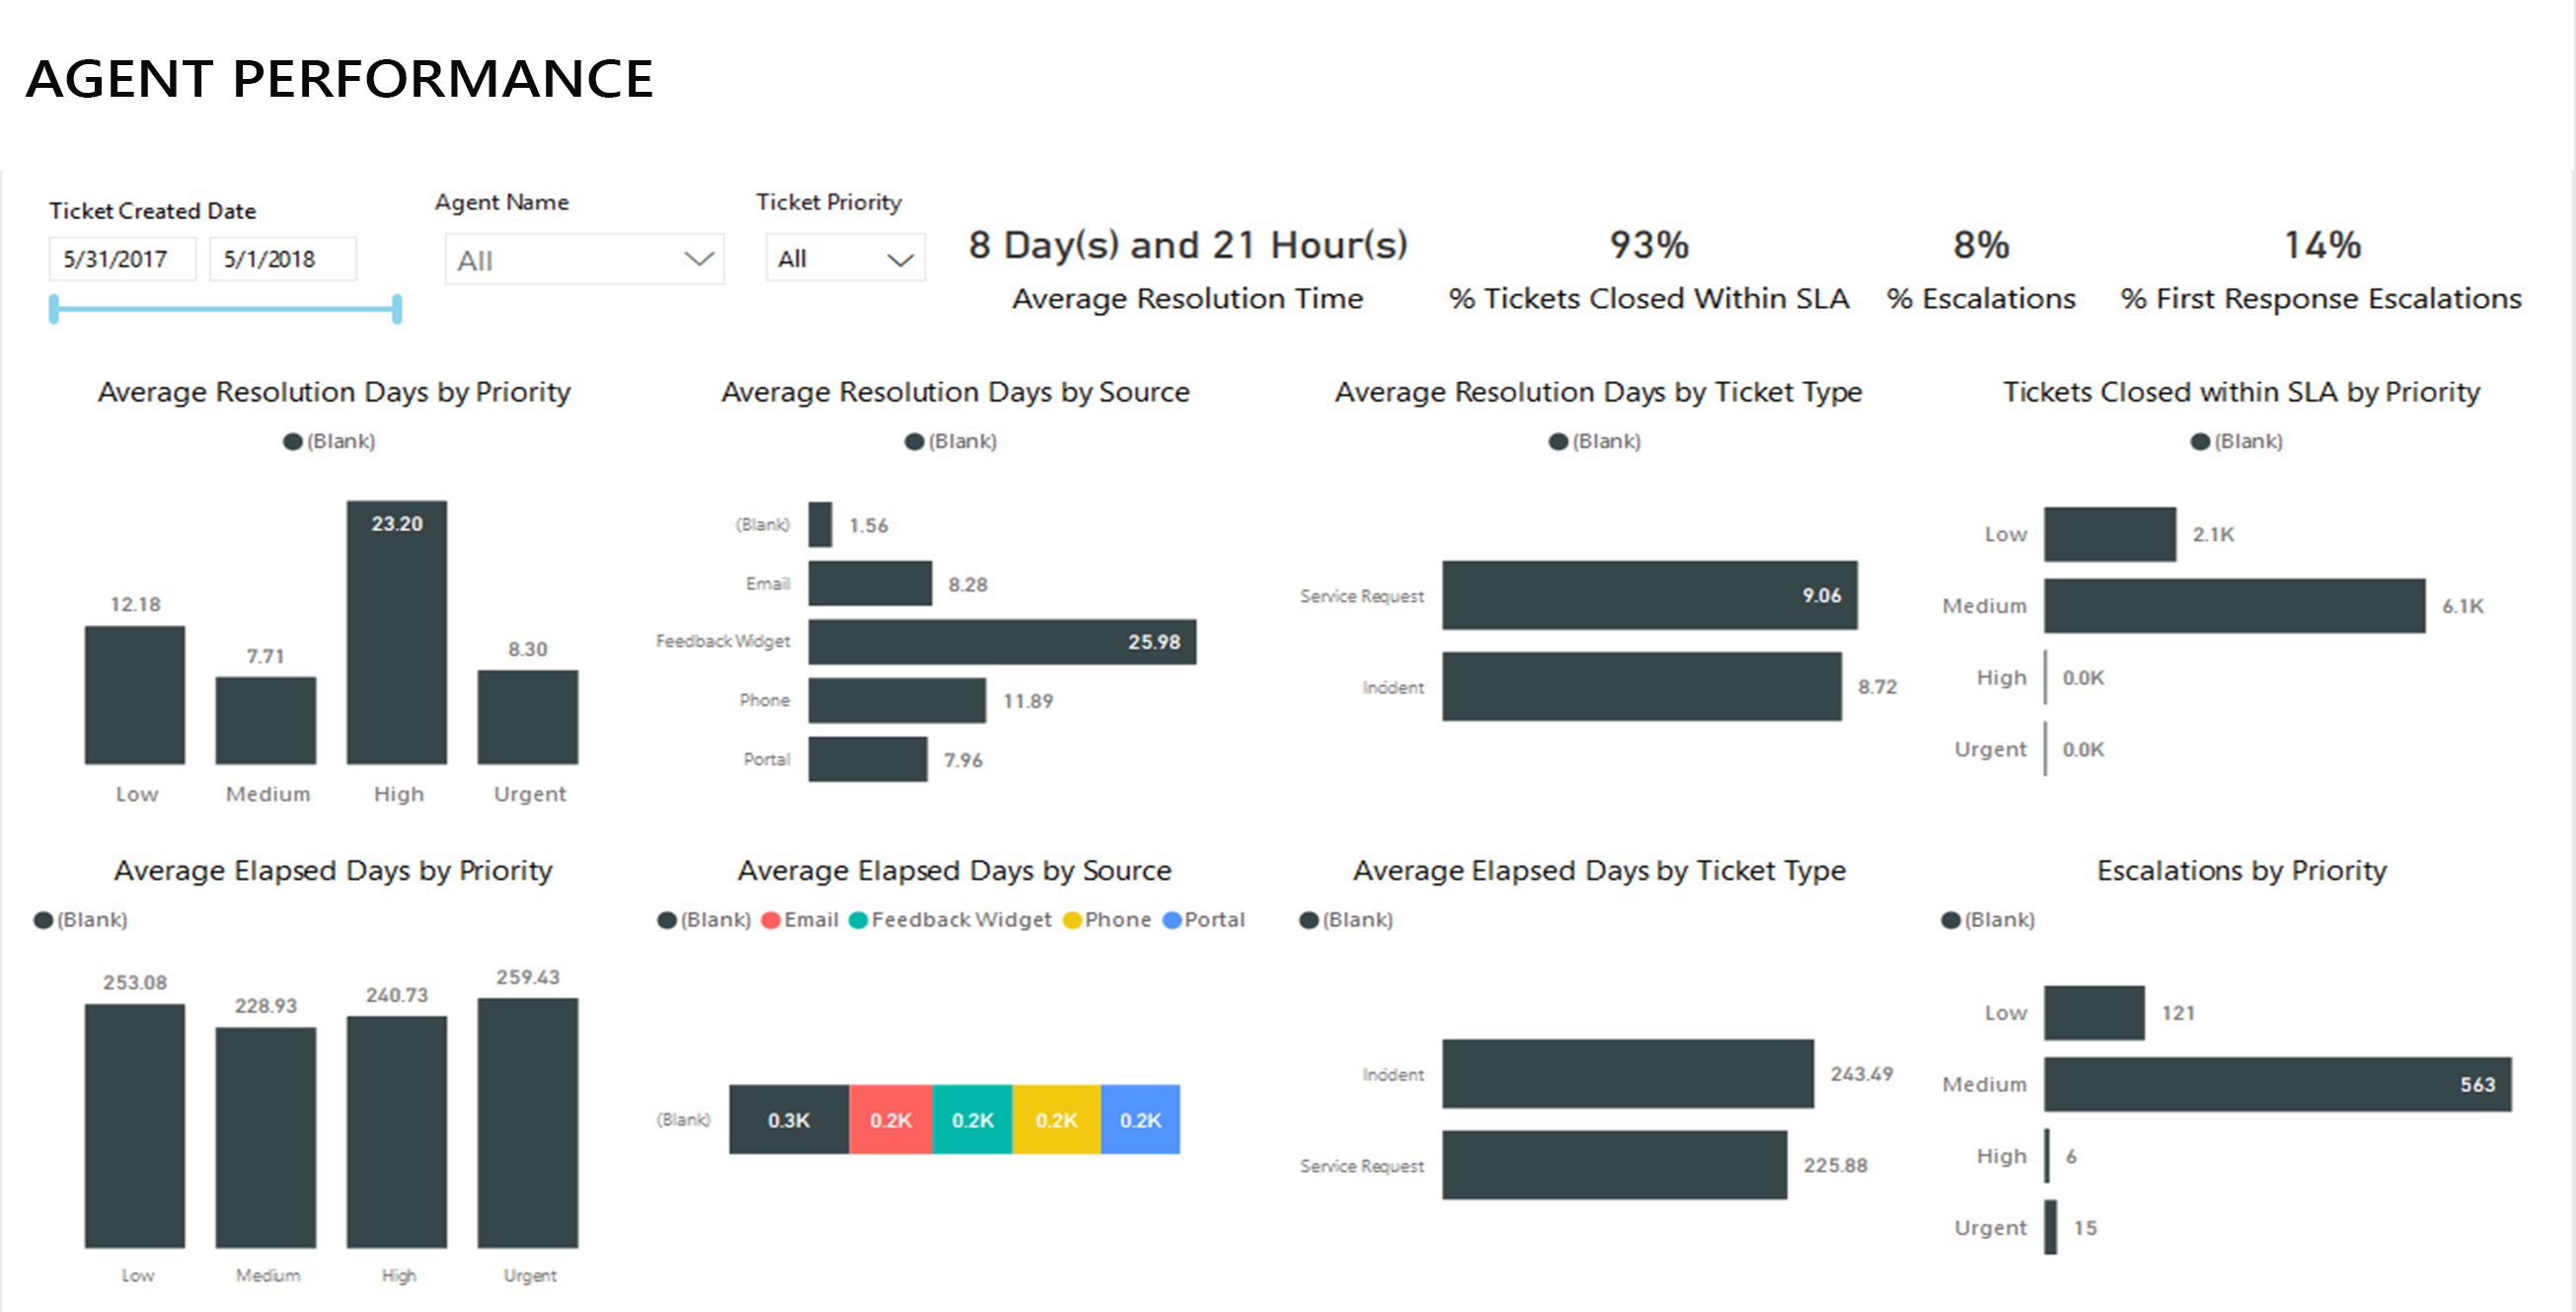
 Agent Performance Analysis
This dashboard measures the performance of the agents and also provides a comparison among the agents across various important parameters over a period of time.
 Customized reporting & dashboards
In addition to the above mentioned KPIs/Dashboards, we also offer customized reporting/dashboards based on your needs. We also provide hosting on your inhouse server. Please contact us for the same.
As part of enabling PowerBI Reporting for Freshservice, a short registration process needs to be completed. Once the registration process is complete we would activate our connectors to link the PowerBI reporting engine to your Freshservice instance to provide rich visualization for your Freshservice data. Also we take care of periodic refreshes to pull data and keep the reporting engine up-to-date. While the basic reporting and periodic refreshes are offered as part of the basic free tier, for customised reporting, timely refresh, role based security, email support etc can be availed as part of paid tier for a nominal monthly fee.
16192, Coastal Highway,
Lewes, County of Sussex, Delaware 19958